# Shipping analytics
URL: https://support.starshipit.com/articles/6269438607887-shipping-analytics
Canonical: https://support.starshipit.com/articles/6269438607887-shipping-analytics
Markdown: https://support.starshipit.com/articles/6269438607887-shipping-analytics.md
Updated: 2026-06-15
> For the complete documentation index, see [llms.txt](https://support.starshipit.com/llms.txt).
> Use shipping analytics to review order volume, carrier performance, delivery timing, and fulfilment trends.
Use shipping analytics to review order volume, compare carrier performance, and identify whether shipments are being delivered early, on time, or late.
:::info
Multi-workstation accounts do not have access to shipping analytics.
:::
## Before you begin
Shipping analytics uses data from orders and shipments in your Starshipit account. Some dashboard filters or charts may not show options until matching shipment data exists.
Shipping performance is supported for:
- StarTrack
- eParcel
- MyPost Business
- DHL Express
- Team Global Express
## Watch the overview
Use the video that matches your Starshipit interface.
## Use shipping analytics
Use shipping analytics to:
- Identify why carrier performance is above or below target.
- Compare carriers or services on the same route.
- Review fulfilment and transit trends over time.
- Export or reuse performance data in reporting tools such as Power BI.
Shipping analytics has two dashboards: **Shipping summary** and **Shipping performance**.
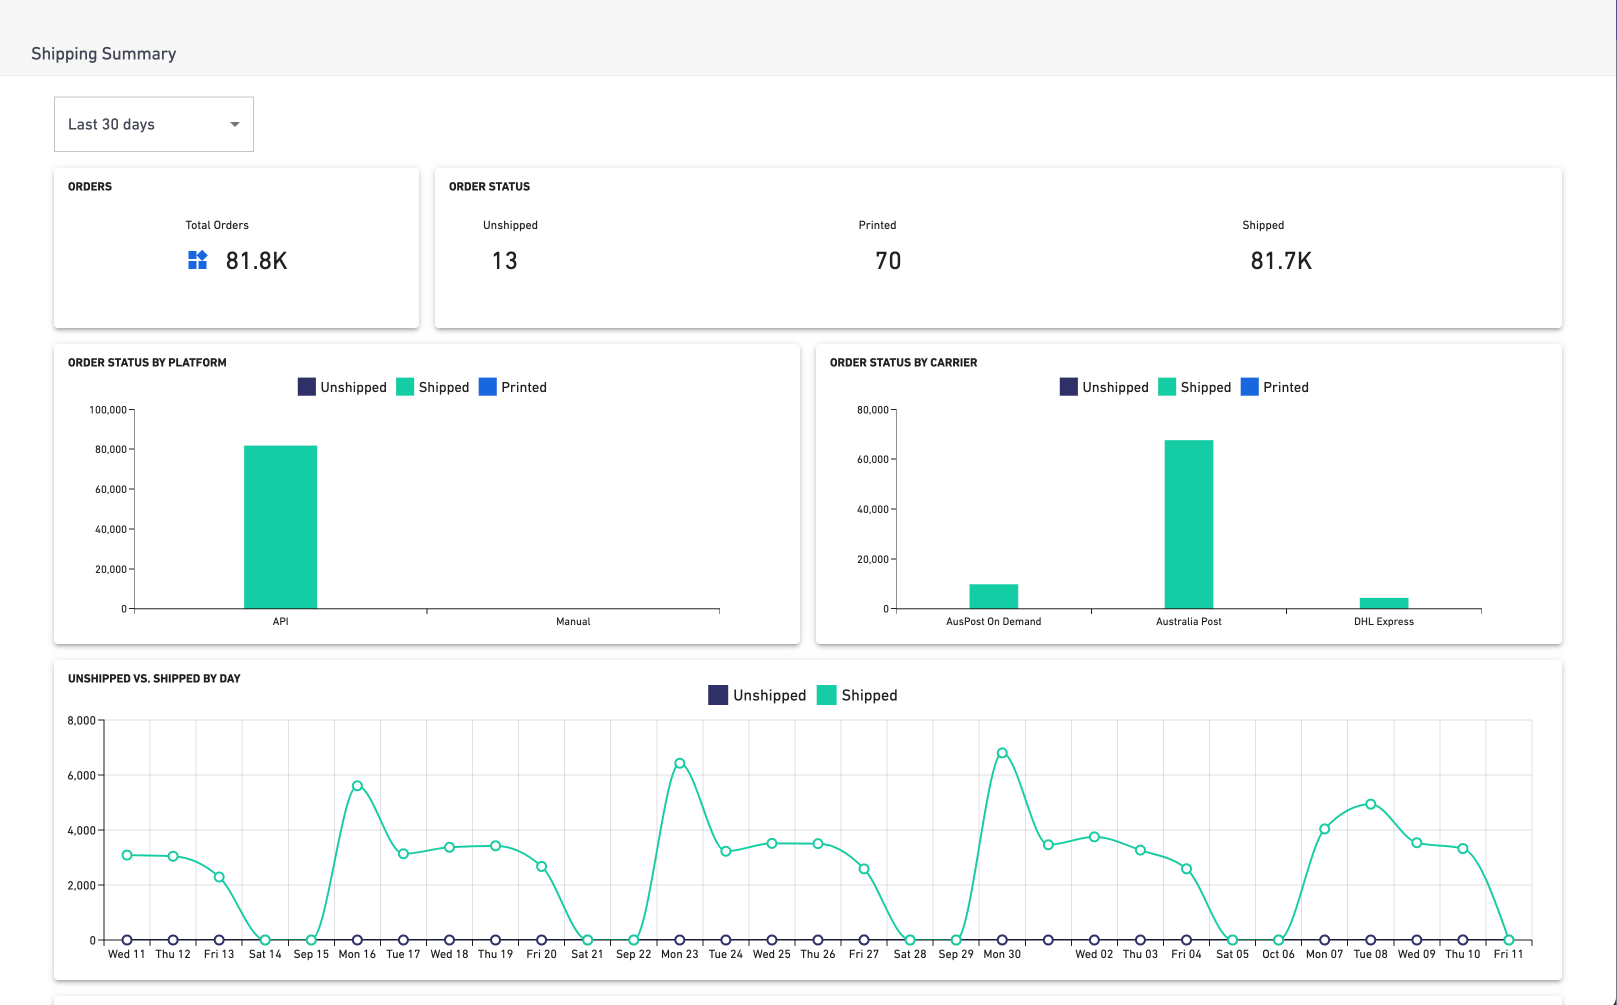
## Review shipping summary
The **Shipping summary** dashboard shows order volume split by platform and carrier. Use the date range filter at the top of the page to control the reporting period.
The dashboard includes these views:
| View | Shows |
| --- | --- |
| **Orders** | Total number of orders created. |
| **Order status** | Total number of unshipped, printed, and shipped orders. |
| **Order status by platform** | Unshipped, printed, and shipped orders grouped by platform. |
| **Order status by carrier** | Unshipped, printed, and shipped orders grouped by carrier. |
| **Unshipped vs shipped by day** | Daily comparison of unshipped and shipped orders. |
| **Order status by child account** | Order status for multi-location, 3PL, and full-access child accounts. |

## Review shipping performance
The **Shipping performance** dashboard helps you check whether carrier services are meeting delivery KPIs. For example, you can see whether orders are being delivered early, on time, or late.
Use the filters at the top of the page to segment dashboard data. The filter choices apply to every visual on the dashboard.
| Filter | Use it to |
| --- | --- |
| **Domestic/international** | View domestic or international shipments. |
| **Date range** | Filter shipments created between selected dates or a preset period, such as the last 30 days. |
| **Carrier** | Compare multiple carriers or focus on one carrier. |
| **Shipping Method** | Compare services such as overnight, express, or other configured methods. |
:::info
If there are no matching data points, the filter bar will not return filter options.
:::
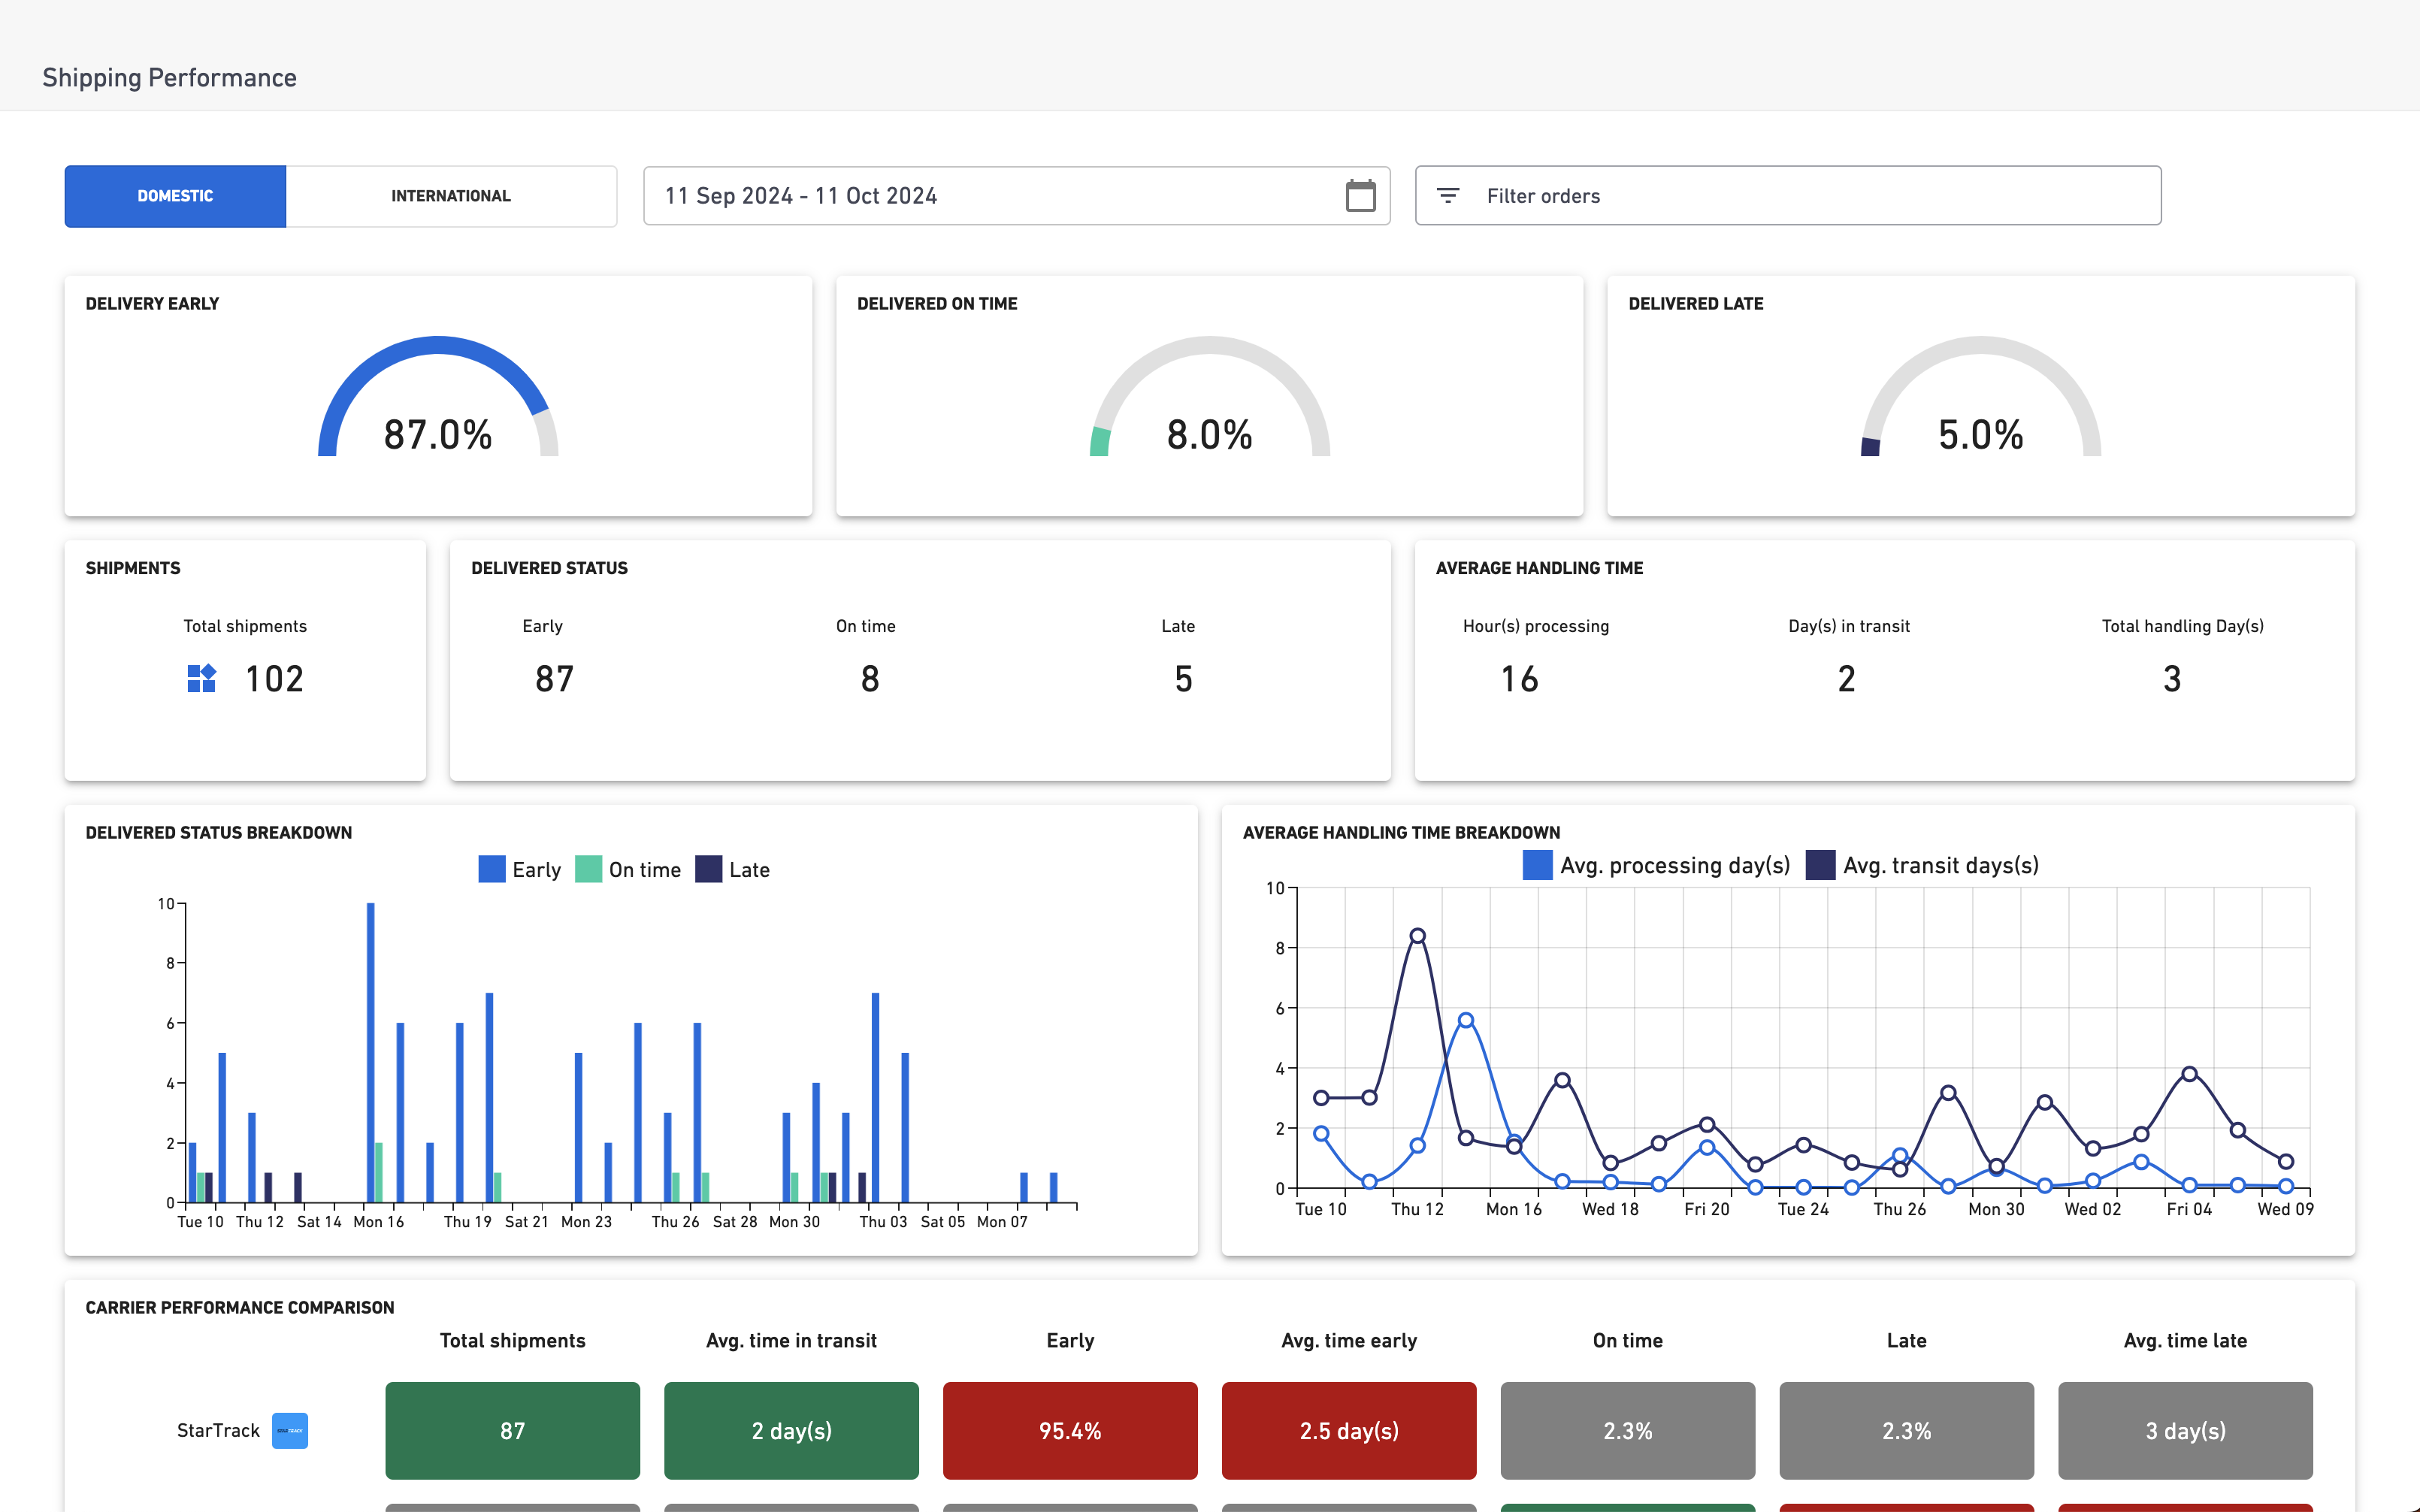

## Understand shipping performance metrics
| Metric or chart | What it tells you |
| --- | --- |
| **KPI gauges** | The percentage of shipments delivered early, on time, or late according to carrier data. |
| **Score cards** | Shipment volume for the selected filters and how that volume is split across key metrics. |
| **Delivered status** | How many shipments were delivered early, on time, or late. |
| **Average handling time** | Average warehouse processing time, average transit time, and total fulfilment time. |
| **Delivered status breakdown** | Delivery performance across a selected time span, helping you spot dates or volume spikes linked to missed KPIs. |
| **Average handling time breakdown** | Warehouse and transit time trends across a selected time range. |
| **Carrier performance analysis** | A heatmap comparing carriers by total shipments, average transit time, early deliveries, on-time deliveries, late deliveries, and average late time. |
Average handling time appears in hours when the average is less than 24 hours, and in days when the average is more than 24 hours.
## Verify your analysis
After changing filters, check that the dashboard visuals update to match the selected carrier, service, date range, and domestic or international setting. If a chart has no data, widen the date range or remove filters to confirm whether matching shipments exist.
## Related articles
- [Generating reports](/articles/360000383635-generating-reports)
- [Scheduled reporting](/articles/6930762037263-scheduled-reporting)
- [View the quoted shipping cost for orders](/articles/4404304727695-view-the-quoted-shipping-cost-for-orders)